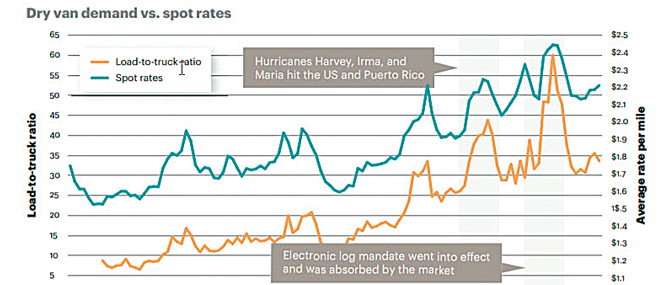
Spot rates for trucking increased drastically as capacity tightened in the second half of 2017. The trend is illustrated in the accompanying graph from the annual State of Logistics Report by the Council of Supply Chain Management Professionals, which was issued earlier this year.
A number of short-term factors contributed to the capacity crunch last year. For example, there were hurricanes in Texas and Puerto Rico; those disasters triggered massive demand for capacity to deliver relief supplies, and the crucial freight hub in Houston was submerged.
In addition, the federal government mandate for electronic logging device (ELD) took effect in December 2017. The new regulation affected more than three million drivers who had not yet implemented the new tracking system.
The ELD technology exacerbates capacity pressures by ensuring that carriers adhere closely to rules that limit a driver’s time behind the wheel. Stricter enforcement of time limits means carriers need more drivers to move the same amount of cargo — coming at a time when drivers already are in short supply.
Tightening of capacity appears to be most pronounced in the 500- to 600-mile band at the edge of a full day’s driving range. However, shipments traveling 1,000-1,200 miles also have been affected.
“We expect the impact to increase this year, as full ELD enforcement began in April 2018,” wrote the report authors.
Carriers can expect even more regulatory constraints on driver availability by 2020. That’s when all trucking companies must comply with the Federal Motor Carrier Safety Administration online database of failed driver drug tests.
These short-term factors that put pressure on capacity have compounded the impact of a decline in the number of truck drivers that has been going on for years. Figures by the American Trucking Associations (ATA) show the trucking industry was short 50,000 drivers at the end of 2017. That is a record shortfall that forces carriers to keep raising wages.
The ATA estimates that average driver pay rose 15-18% between 2013 and 2017. However, companies have only corrected years of stagnant salary growth for drivers.
The rise in spot rates reflected a broader trend. After declining in 2016 for the first time since 2009, U.S. Business Logistics Costs (USBLC) returned to higher levels in 2017 with a 6.2% increase year-over-year. The pace of spending increases became pronounced, especially in the fourth quarter of 2017. The main drivers were a robust economic climate with growing demand, strong job market, rising wages, and driver shortages. The driver shortages are not new, but they have intensified significantly.
Costs rose across all components of U.S. business logistics costs: transportation, inventory carrying costs, and other expenses. Transportation increased 7% to lead the way; costs were well above inflation for every shipping mode except waterborne freight. Private or dedicated fleet and rail saw the biggest hikes as shippers scrambled to lock up capacity. Dedicated trucking costs climbed 9.5%, leading an over-the-road sector that experienced some of the sharpest spending increases last year. Parcel and express deliveries — closely tied to e-commerce — increased 7% although it slipped from last year’s first place finish. Even less-than-truckload motor freight rose 6.5% after steadily dropping in recent years.
At the midpoint of 2018, there were signs of continued constraints on capacity and sustained high prices. Given that consumer confidence reached its highest level since 2004 and that optimistic retailers have increased inventories at both the wholesale and retail levels, pressures on capacity and pricing are likely to intensify.


